Navigating Revenue, Churn, and Customer Dynamics
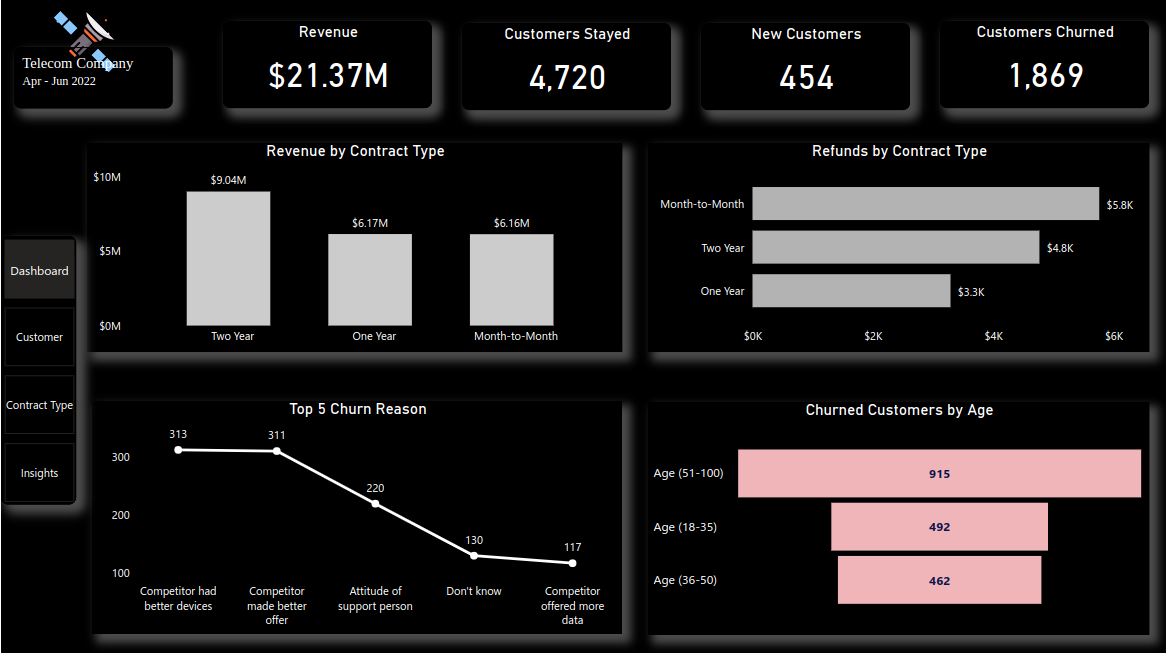
The Telecom Company’s Power BI dashboard offers a comprehensive snapshot of its performance metrics. It highlights crucial key performance indicators (KPIs) such as total revenue, customer retention, new customer acquisitions, and churned customers. Additionally, the dashboard provides insights into revenue and refunds categorized by contract type, allowing for a deeper understanding of financial dynamics. The top five churn reasons are identified, aiding in proactive strategies to reduce churn rates. The report also breaks down churns by age groups. Moreover, it offers detailed insights into revenue, refunds, and contract reports, empowering data-driven decisions for optimizing customer relationships and financial outcomes.