Revenue, Profit, and Product Analysis
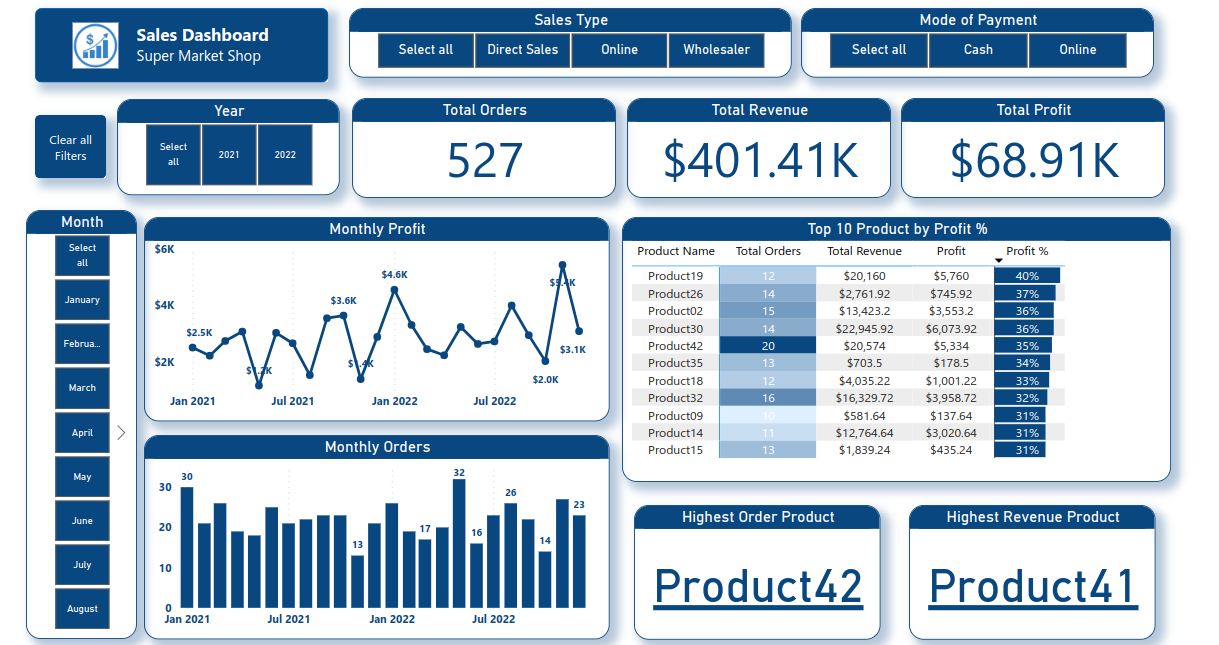
The Supermarket dashboard provides a concise overview of essential business metrics. Key indicators like total revenue, total orders, and profit are prominently displayed, offering immediate insights into financial performance. Monthly profit and orders visualizations allow for trend analysis, aiding in decision-making. Additionally, the dashboard identifies top-performing products by profit percentage. KPI cards highlight the highest-order and highest-revenue products for quick reference. The report also offers the convenience of drilling through to more detailed product and product category insights, facilitating data-driven strategies to optimize sales and profitability within the supermarket’s operations.
