Current Month Insights
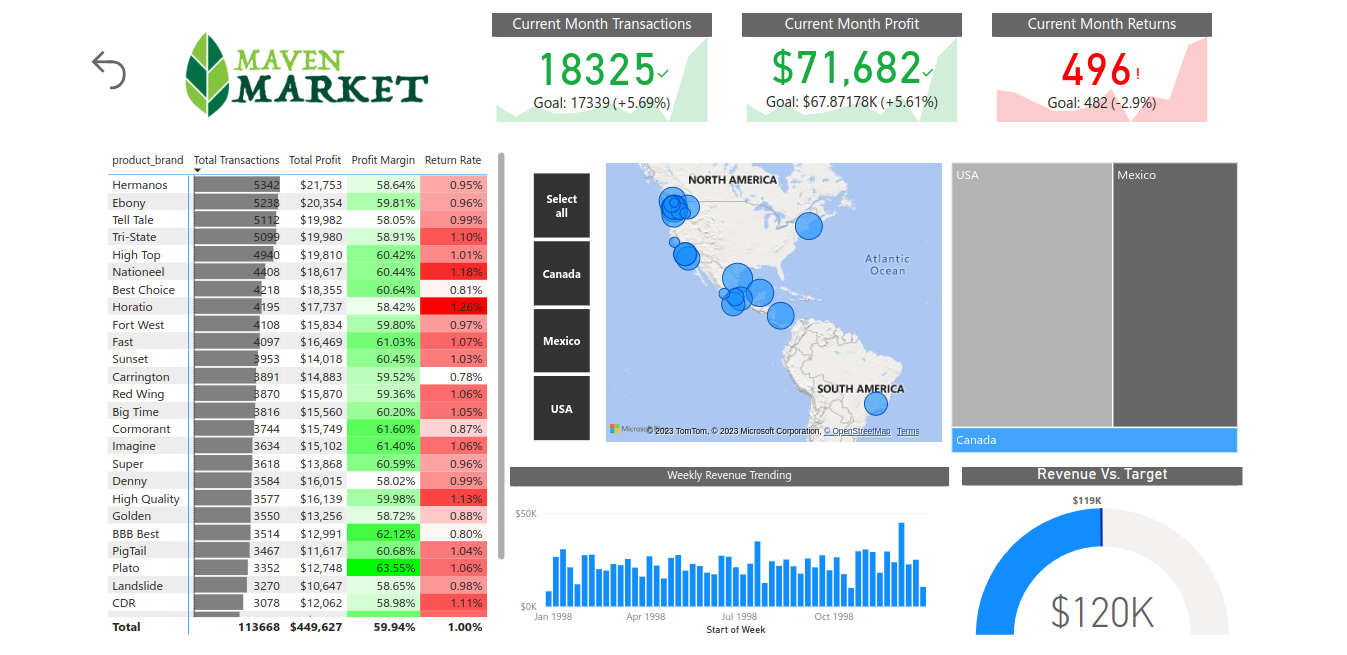
The Power BI dashboard for the Multinational Grocery Chain offers a snapshot of the current month’s financial performance. It prominently displays key metrics like current month transactions, current month profit, and current month returns, providing immediate insights. Weekly revenue trends help track sales patterns, while a gauge chart visually indicates whether revenue meets the set target. Additionally, the dashboard provides a geographical representation based on transactions, offering a spatial perspective of sales activity. This comprehensive tool empowers the grocery chain with data-driven decision-making, enabling them to optimize operations and financial results efficiently.
